
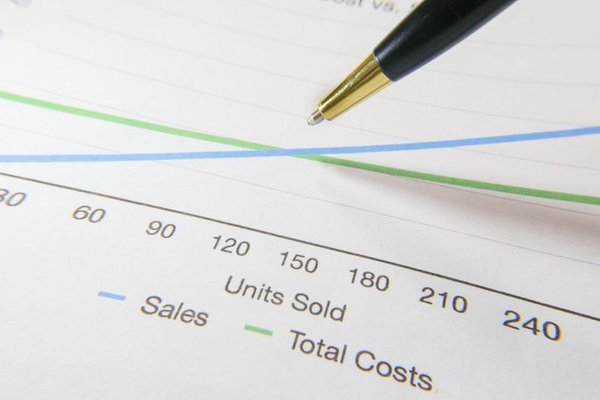
A small business can enjoy a strong sales month yet have surprisingly little money left after paying its bills. Revenue shows what customers buy; profit shows what remains after costs. Profit margin for small business connects those figures, revealing what percentage of sales becomes profit.
That makes margin useful alongside profit statements, budgets and break-even analysis. It can expose rising costs, unprofitable discounts or growth that looks impressive without improving financial performance. The key is calculating the right margin and interpreting it carefully.
What Does Profit Margin Measure?
Profit margin is profit divided by revenue, expressed as a percentage. A 10% net margin means the business earned 10 in net profit for every 100 of revenue during the period measured. It does not mean that 10% of its bank balance is free to spend.
Two businesses might each make 5,000 in profit, but one generates 50,000 in sales while the other generates 100,000. Their net margins are 10% and 5%, respectively. The first converts more of each sale into profit, although differences in business models still matter.
How to Calculate Business Profit Margin
The formula is profit margin = profit ÷ revenue × 100. Match the figures to the same accounting period, and use revenue after relevant discounts and returns. The definition of profit you choose changes what the result tells you.
Gross Profit Margin
Gross margin = (revenue − cost of goods sold) ÷ revenue × 100. Cost of goods sold includes costs directly attributable to goods sold; for service businesses, the equivalent is often called direct cost of sales. Exact classifications depend on the business and its accounting methods.
Gross margin indicates whether prices cover the direct costs of delivering sales. General overheads, such as office administration, are normally considered separately.
Net Profit Margin
Net margin = net profit ÷ revenue × 100. Net profit remains after all expenses recognised in the period, including operating expenses, financing costs and applicable taxes.
This broader business profit margin shows how revenue becomes final earnings. A healthy gross margin can still produce a disappointing net margin when rent, payroll or borrowing costs run high.
A Small Retailer’s Profit Margin Example
Imagine a homeware retailer making 20,000 in monthly revenue. The inventory sold costs 12,000, leaving 8,000 of gross profit. Its gross margin is 8,000 ÷ 20,000 × 100 = 40%.
The shop also records 5,000 in operating expenses, including rent, wages and advertising, plus 1,000 in interest and tax expense. Net profit is 2,000, so net margin is 2,000 ÷ 20,000 × 100 = 10%.
Next month, sales grow to 24,000, but discounts and supplier price increases reduce gross margin to 35%. Gross profit is now 8,400. If other expenses stay at 6,000, net profit becomes 2,400 and net margin remains 10%. Revenue rose, but the business still keeps the same percentage of sales as net profit.
This is why tracking margins alongside turnover matters. Growing sales can conceal weaker pricing or rising direct costs.
Reading Margin Trends
A margin calculated once is a snapshot. Monthly or quarterly margin analysis reveals whether a change persists or reflects seasonality or an unusual expense.
When gross margin falls, investigate supplier costs, wastage, discounts, delivery expenses and product mix. If gross margin holds steady while net margin drops, examine overheads, financing costs and expenses growing faster than revenue.
Service businesses should also examine profitability by project. Underestimated staff hours and unpaid revisions can turn a busy client account into a low-margin one. Keep a monthly record of revenue, direct costs, operating expenses and both margins, with brief notes explaining changes.
That record complements small-business budgeting and cash flow forecasting. Profitability and cash availability are related but different measures.
Understand Margin Before Changing Prices
Margin and markup are different. Margin compares gross profit with selling price; markup compares it with cost. If a product costs 30 and sells for 50, gross profit is 20. Gross margin is 40%, while markup is approximately 66.7%.
Suppose the retailer wants a 50% gross margin. The target price is cost ÷ (1 − desired margin), or 30 ÷ 0.50 = 60. A 50% markup instead produces a price of 45 and a gross margin of only 33.3%.
This is a starting point, not a guarantee. Customer demand, competition, returns and other costs affect actual profit. Test whether the price is commercially realistic before applying a target percentage.
How Margin Fits With Break-Even Analysis
Do not automatically use gross margin in a break-even calculation. Break-even planning generally uses contribution margin: revenue minus variable costs. Some cost-of-sales items may be fixed, while some selling expenses vary with each order.
For example, a service earns 100 per booking and incurs 40 in variable costs, leaving a contribution of 60. With monthly fixed costs of 3,000, the business needs 50 bookings to break even, assuming those figures remain constant.
Use profit margins to assess profitability, break-even analysis to estimate required sales, and cash flow forecasts to anticipate money entering and leaving. These tools complement one another.
What Is a Good Profit Margin for a Small Business?
There is no universal benchmark. A retailer may succeed with a lower net margin than a specialist consultancy. Industry, pricing model, location and accounting choices shape reasonable expectations.
Compare results with your own historical performance first. When using external benchmarks, choose genuinely comparable businesses rather than treating an industry average as a required target. A sustainable margin supports regular costs, risk and reinvestment.
Frequently Asked Questions
Is gross margin or net margin more important?
Both are useful. Gross margin focuses on direct costs and pricing; net margin captures the wider expenses of running the business. Together they help identify where profitability changes arise.
Can a profitable business have cash flow problems?
Yes. Customers may pay invoices late, inventory purchases may use cash before goods are sold, and loan principal repayments may reduce cash without appearing as expenses in net profit.
How often should profit margin be reviewed?
Monthly monitoring suits many small businesses, supported by quarterly comparisons. Firms facing rapid cost changes or tight margins may need more frequent reviews.
Does raising prices always improve net margin?
No. Higher prices may reduce demand or change the mix of products customers buy. Evaluate the effects on revenue, direct costs and operating expenses first.
Turn the Numbers Into Decisions
A margin percentage becomes valuable when it prompts a question: Are suppliers charging more? Are discounts too generous? Are overheads rising faster than sales? Calculate gross and net margins consistently, follow their trends, and use the findings alongside budgets and break-even figures to make better-informed pricing and cost decisions.